QNX Toolkit for VS Code 1.1 - Smarter, Faster, Seamless Development
Whether you’re new to VS Code for QNX or revisiting it, the new QVSC 1.1 offers a polished productive experience that’s worth exploring.
This is a guest post from Mayank Goel, a Technical Product Manager at QNX championing improvements to the QNX Toolkit for VS Code based on feedback from customers and QNX enthusiasts.
If you have been working with QNX, you probably know the QNX Toolkit for VS Code (QVSC) brings the power of SDP 8.0 into the VS Code, the streamlined and highly customizable code editor trusted by millions. And with version 1.1, the toolkit takes another meaningful step forward, introducing refinements across the System Profiler, debugging experience, and general usability. The result is a workflow that feels more natural, and in tune with the way developers navigate VS Code every day.
For a closer look at all the features and enhancements, the QVSC 1.1 User Documentation provides detailed walkthroughs, tips, and examples to help you get started right away.
A Toolkit That Keeps Up With You
QVSC isn’t just a code editor plugin; rather, it is a full featured development environment designed for real world QNX projects. You can create projects, build them, debug, trace, and profile, all without leaving VS Code.
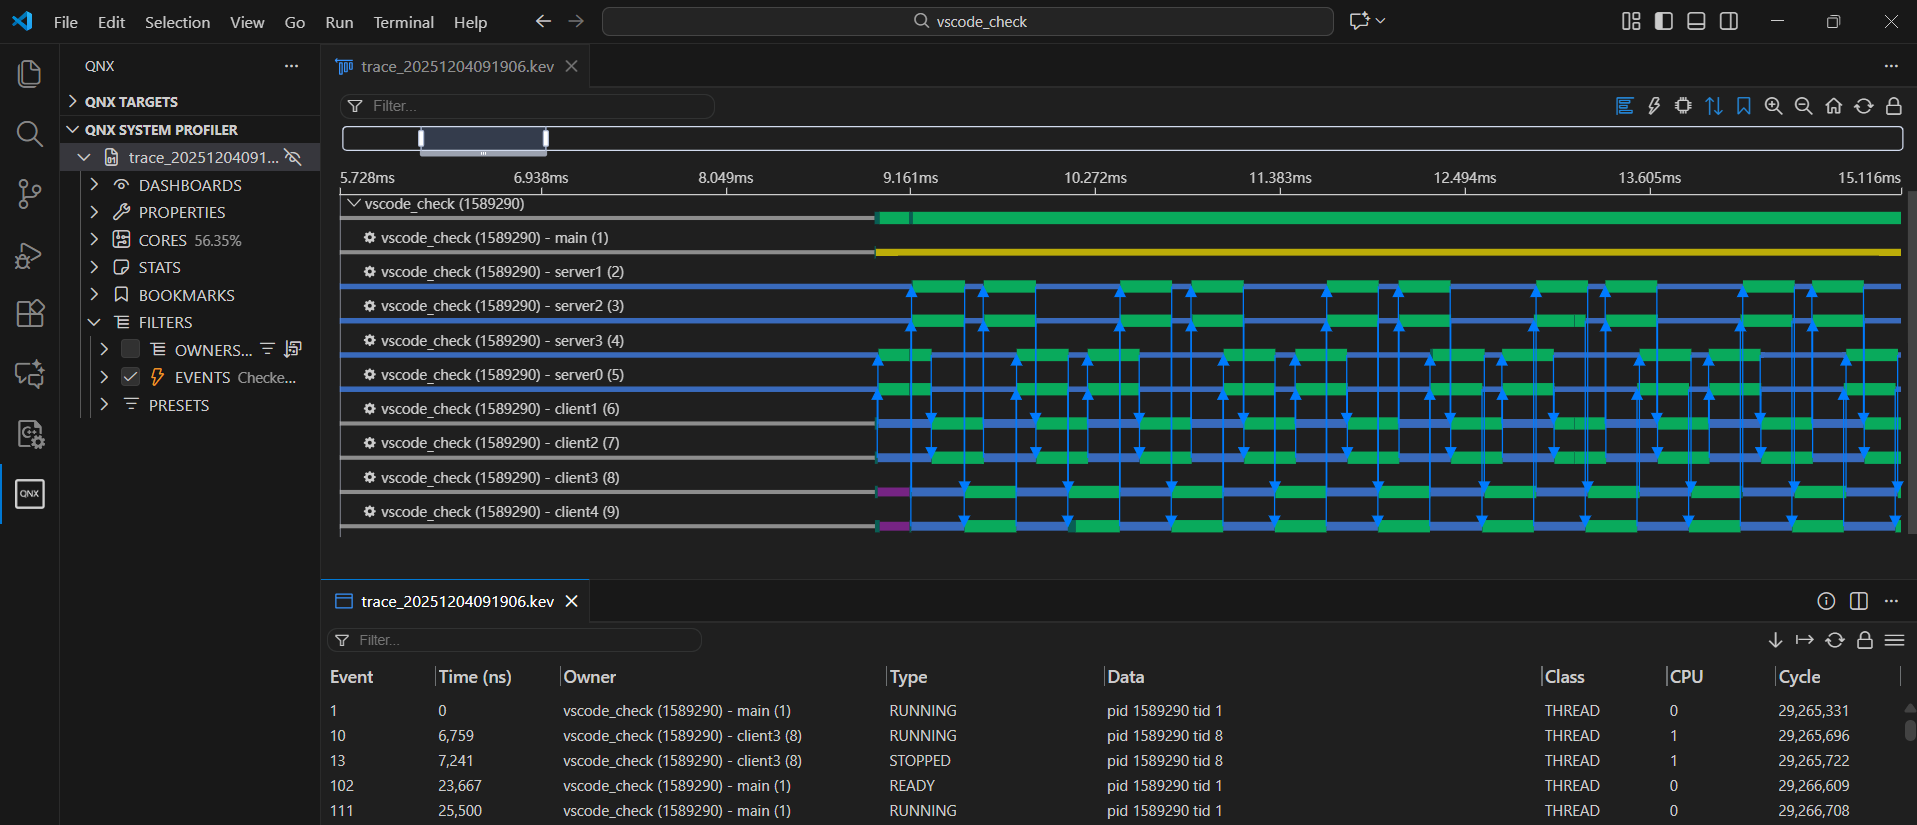
One of the standout improvements in v1.1 is the System Profiler. It’s faster, smoother, and more responsive than ever. Everything is now built directly into VS Code, so there’s no need for additional dependencies and third-party extensions. The Timeline dashboard now visualizes IPC interactions between threads, giving you a clear picture of communication across cores and processes.
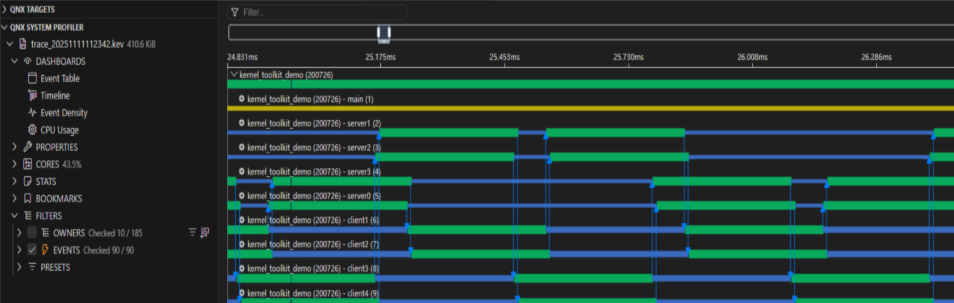
This view shows a kernel trace with multiple processes and IPC interactions across cores. Each line represents a thread, while the connections between them visualize messaging and synchronization events in real time. By examining these interactions, developers can pinpoint performance bottlenecks, detect contention points, and gain a deeper understanding of how threads communicate within the system. The Timeline dashboard makes complex multicore behavior more visible and easier to analyze - all directly within VS Code, without relying on external tools.
QVSC 1.1 is designed with practical QNX development in mind:
- Full integration with SDP 8.0, ensuring all tools work seamlessly together.
- Multicore aware profiling and debugging, helping you take full advantage of modern hardware.
- Flexible project workflows with support for both CMake and Makefiles.
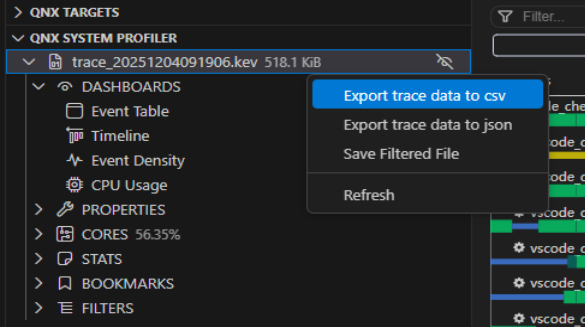
- Exportable trace data for detailed offline analysis or reporting.
- Clean workspace management with separate terminals for program output.
To put simply, it is a toolkit that fits your workflow rather than forcing you to adapt to it.
Trace, Analyze, Share
QVSC 1.1 doesn’t just collect trace data, it makes it actionable as well. You can export traces as CSV files, letting you analyze performance or share results with teammates. Multicore profiling is smoother too: you can trace interactions between threads, pinpoint bottlenecks, and gain insights into complex system behavior with minimal setup.
Whether you are troubleshooting performance issues, exploring system behavior, or optimizing multicore workloads, the Toolkit now gives you more visibility, more flexibility, and more confidence.
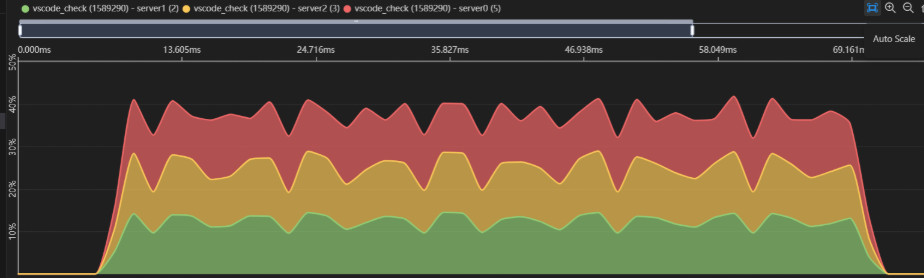
Instant Insights with CPU Auto Scale
Keeping track of CPU utilization across cores is critical in embedded development, but charts can be hard to interpret when workloads fluctuate. QVSC 1.1 introduces a powerful Auto Scale toggle in the CPU Usage dashboard.
With Auto Scale enabled, CPU charts dynamically adjust to spikes and dips, letting you see utilization patterns at a glance without manually resizing the view. For developers working on multicore applications or performance - critical systems, this small enhancement makes monitoring system behavior more intuitive and responsive, thus helping you to spot potential bottlenecks and inefficiencies in real time.
With Auto Scale Disabled:
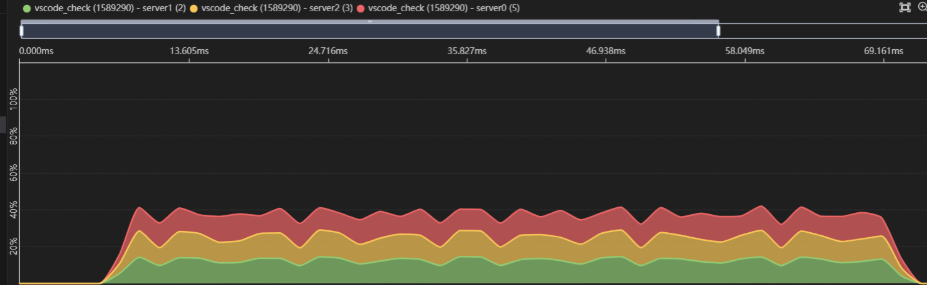
With Auto Scale Enabled:
Hands-On Tutorials
One of the biggest strengths of QVSC 1.1 is the set of hands-on tutorials and example workflows included in the updated user documentation. They walk you through the Toolkit’s features in a practical, step-by-step way, so you can get started quickly without needing to dig through long manuals.
Whether you want to:
- Set up and configure your first QNX project in VS Code
- Explore the System Profiler and CPU dashboards,
- Visualize thread interactions and IPC in the Timeline view, or
- Trace and debug applications on a live or virtual target
- Build and customize your own Board Support Package (BSP)
These interactive walkthroughs guide you step by step, making it easier to understand how the Toolkit works and how to apply it to real projects.
For developers new to QVSC, or those revisiting the Toolkit after earlier releases, the tutorials are a fast track to productivity. You can access them here:
QVSC Tutorials.
Get Started Today
QVSC 1.1 is available now on the Visual Studio Marketplace:
Get up to speed quickly with the QVSC 1.1 user guide, now packed with interactive examples, guided tutorials, and clear walkthroughs of key features:
QVSC 1.1 empowers you to take full control of QNX development, making coding, debugging, and profiling more interactive and intuitive than ever. From exploring multicore interactions in the System Profiler to running projects seamlessly in VS Code, this new release gives you the tools to understand your system like never before.
Jump in today, try the tutorials, and see how QVSC 1.1 can transform the way you develop on QNX.
Get Help and Share Feedback
Lastly, if you want some help or have feedback to share, you can find the QNX team and community:
- in Discord here: discord.gg/Jj4EkkrFTT
- on Reddit at: reddit.com/r/qnx


